<< Previous page INDEX Next page >>
8.4 Selecting a Lasting Battery
As part of an ongoing research program to find the optimum battery system for selected applications, Cadex has performed life cycle tests on NiCd, NiMH and Li-ion batteries. All tests were carried out on the Cadex 7000 Series battery analyzers in the test labs of Cadex, Vancouver, Canada. The batteries tested received an initial full-charge, and then underwent a regime of continued discharge/charge cycles. The internal resistance was measured with Cadex’s Ohmtest™ method, and the self-discharge was obtained from time-to-time by reading the capacity loss incurred during a 48-hour rest period. The test program involved 53 commercial telecommunications batteries of different models and chemistries. One battery of each chemistry displaying typical behavior was chosen for the charts below.
When conducting battery tests in a laboratory, it should be noted that the performance in a protected environment is commonly superior to those in field use. Elements of stress and inconsistency that are present in everyday use cannot always be simulated accurately in the lab.
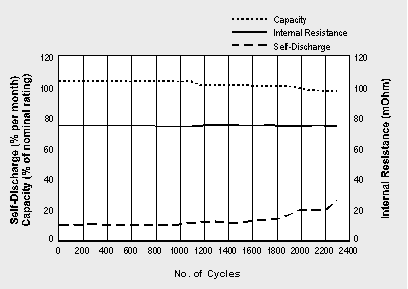
The NiCd Battery — In terms of life cycling, the standard NiCd is the most enduring battery. In Figure 8-1 we examine the capacity, internal resistance and self-discharge of a 7.2V, 900mA NiCd battery with standard cells. Due to time constraints, the test was terminated after 2300 cycles. During this period, the capacity remains steady, the internal resistance stays flat at 75mW and the self-discharge is stable. This battery receives a grade ‘A’ for almost perfect performance.
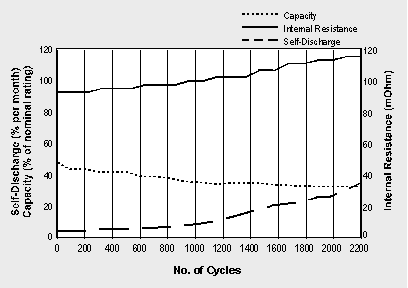
The readings on an ultra-high capacity NiCd are less favorable but still better than other chemistries in terms of endurance. Although up to 60 percent higher in energy density compared to the standard NiCd version, Figure 8-2 shows the ultra-high NiCd gradually losing capacity during the 2000 cycles delivered. At the same time, the internal resistance rises slightly. A more serious degradation is the increase of self-discharge after 1000 cycles. This deficiency manifests itself in shorter runtimes because the battery consumes some energy itself, even if not in use.
Figure 8-1: Characteristics of a standard cell NiCd battery.
This battery deserves an ‘A’ for almost perfect performance in terms of stable capacity, internal resistance and self-discharge over many cycles. This illustration shows results for a 7.2V, 900mA NiCd.
Figure 8-2: Characteristics of a NiCd battery with ultra-high capacity cells.
This battery is not as favorable as the standard NiCd but offers higher energy densities and performs better than other chemistries in terms of endurance. This illustrations shows results for a 6V, 700mA NiCd.

