NOTE: THIS DOCUMENT IS OBSOLETE, PLEASE CHECK THE NEW VERSION: "Mathematics of the Discrete Fourier Transform (DFT), with Audio Applications --- Second Edition", by Julius O. Smith III, W3K Publishing, 2007, ISBN 978-0-9745607-4-8. - Copyright © 2017-09-28 by Julius O. Smith III - Center for Computer Research in Music and Acoustics (CCRMA), Stanford University
<< Previous page TOC INDEX Next page >>
Motivating Example and Overview
Suppose you look up the documentation for a ''comb filter'' in a software package you are using, and you find it described as follows:
out(n) = input(n) + feedforward * input(n-delay1) - feedback * out(n-delay2)Does this tell you everything you need to know? Well, it does tell you exactly what is implemented, but to really understand it, you need to see its frequency response. Moreover, if delay2corresponds to more than a a few milliseconds, you probably want to see its impulse response as well. The purpose of this appendix is to describe how to do this analysis.To analyze our example, let's first write it in a more ''mathematical'' form:
The transfer functionis derived by taking the
transform of both side of this equation and solving for the transfer function, defined as
:
The principles of this derivation are as follows
- The
transform
is a linear operator which implies
. That is, the
transform of a signal
delayed by
samples,
, has the
transform
. This is the shift theorem for
transforms, which can be immediately derived from the definition of the
transform, as we do below.
Given the transfer function
, the frequency response is obtained by setting
, where
is the sampling interval in seconds, and
is radian frequency which ranges from
(minus half the sampling rate in radians per second) to
(plus half the sampling rate).
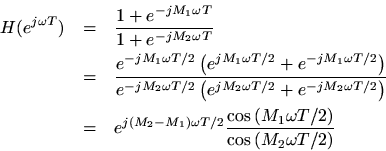
In the special case, we obtain
This special case gives insight into the behavior of the filter as its coefficientsand
get approach 1. When
, the filter degenerates to
which corresponds to
; in this case, the delayed input and output signals cancel each other out.
Since the frequency response is a complex-valued function, it has amagnitude and phase angle. The magnitude of the frequency response is called the amplitude response, and gives the filter gain at each frequency
. In this example, the amplitude response is
which, for, reduces to
FIXME: Give Matlab code and plot of amplitude response here
The phase of the frequency response is called the phase response. Like the phase of any complex number, it is given by the arctangent of the imaginary part of
divided by its real part, and it contains information about the delay of the filter at each frequency. The phase response is a good measure of filter delay when those delays are short (less than a few milliseconds, say). For longer delays, it is usually best to study the filterimpulse response, which can be defined as the inverse-
transform of the filter transfer function (or the inverse Fourier transform of the frequency response).
FIXME: Give Matlab code and plot of phase response and impulse response
This section has provided an overview of filter analysis in the frequency domain. We see that a complete understanding of this analysis requires understanding ofcomplex numbers and the elements of the
transform. A tutorial introduction to these topics is provided in Music 320 Background Reader. Here we will assume that background and focus on practical digital filterstructures and their frequency-domain analysis.


