NOTE: THIS DOCUMENT IS OBSOLETE, PLEASE CHECK THE NEW VERSION: "Mathematics of the Discrete Fourier Transform (DFT), with Audio Applications --- Second Edition", by Julius O. Smith III, W3K Publishing, 2007, ISBN 978-0-9745607-4-8. - Copyright © 2017-09-28 by Julius O. Smith III - Center for Computer Research in Music and Acoustics (CCRMA), Stanford University
<< Previous page TOC INDEX Next page >>
Example 2: FFT of a Not-So-Simple Sinusoid
Now let's increase the frequency in the above example by one-half of a bin:
% Example 2: Same as Example 1 but with a frequency between bins

f = 0.25 + 0.5/N;   % Move the frequency off of the bin center by half a bin

x = cos(2pinfT);  % Signal to analyze
X = fft(x);           % Spectrum

% Plot time data
figure(2);
subplot(3,1,1);
plot(n,x,’’);

ni = [0:.1:N-1];      % Interpolated time axis
hold on;
plot(ni,cos(2pinif*T),’-’);
title(’Sinusoid Sampled at NEAR 1/4 the Sampling Rate’);
xlabel(‘Time (samples)’); ylabel(’Amplitude’);
text(-8,1,‘a)’); hold off;

% Plot spectral magnitude
subplot(3,1,2);
magX = abs(X);
stem(fn,magX); grid;
xlabel(‘Normalized Frequency (cycles per sample))’);
ylabel(‘Magnitude (Linear)’);
text(-0.11,30,‘b)’);

% Same spectrum on a dB scale
subplot(3,1,3);
spec = 20*log10(magX);  % Spectral magnitude in dB
plot(fn,spec); grid
xlabel(‘Normalized Frequency (cycles per sample))’);
ylabel(‘Magnitude (dB)’);
text(-0.11,40,‘c)’);
print -deps eps/example2.eps; hold off;
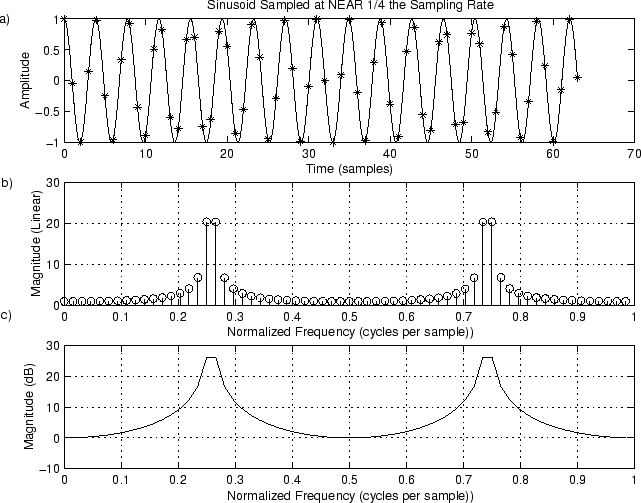
Figure 9.2:Sinusoid at Frequency . a) Time waveform. b) Magnitude spectrum. c) DB magnitude spectrum.
The resulting magnitude spectrum is shown in Fig. 9.2b and c. We see extensive ‘‘spectral leakage’’ into all the bins at this frequency.
To get an idea of where this spectral leakage is coming from, let’s look at the periodic extension of the time waveform:
% Plot the periodic extension of the time-domain signal plot([x,x]); title(‘Time Waveform Repeated Once’); xlabel(‘Time (samples)’); ylabel(‘Amplitude’); print -deps eps/waveform2.eps; % Figure 4 disp ‘pausing for RETURN (check the plot). . .’; pauseThe result is shown in Fig. 9.3. Note the ‘‘glitch’’ in the middle where the signal begins its forced repetition.
Figure 9.3:Time waveform repeated to show discontinuity introduced by periodic extension (see midpoint).

