NOTE: THIS DOCUMENT IS OBSOLETE, PLEASE CHECK THE NEW VERSION: "Mathematics of the Discrete Fourier Transform (DFT), with Audio Applications --- Second Edition", by Julius O. Smith III, W3K Publishing, 2007, ISBN 978-0-9745607-4-8. - Copyright © 2017-09-28 by Julius O. Smith III - Center for Computer Research in Music and Acoustics (CCRMA), Stanford University
<< Previous page TOC INDEX Next page >>
Example 3: FFT of a Zero-Padded Sinusoid
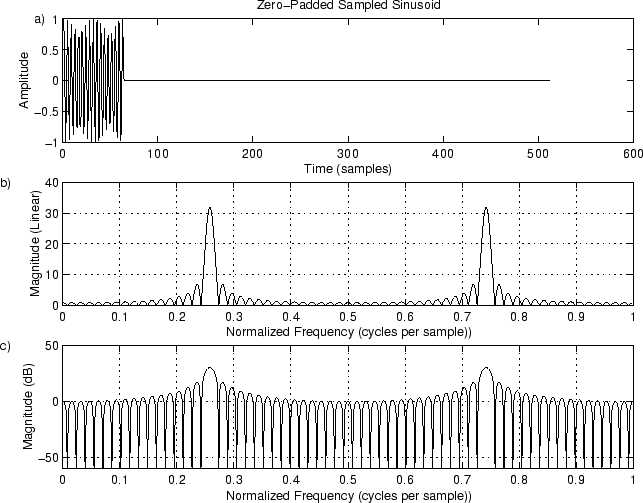
Interestingly, looking back at Fig. 9.2c, we see there are no negative dB values. Could this be right? To really see the spectrum, let's use some zero padding in the time domain to yield ideal interpolation in the freqency domain:
% Example 3: Add zero padding zpf = 8; % zero-padding factor x = [cos(2*pi*n*f*T),zeros(1,(zpf-1)*N)]; % zero-padded FFT input data X = fft(x); % Interpolated spectrum
% Plot time data figure(4); subplot(3,1,1); plot(x);
title(‘Zero-Padded Sampled Sinusoid’); xlabel(‘Time (samples)’); ylabel(’Amplitude’); text(-30,1,‘a)’); hold off;
% Plot spectral magnitude magX = abs(X); nfft = zpf*N; fni = [0:1.0/nfft:1-1.0/nfft]; % Normalized frequency axis subplot(3,1,2); plot(fni,magX,’-’); grid; % With interpolation, we can use solid lines ‘-’ % title(‘Interpolated Spectral Magnitude’); xlabel(‘Normalized Frequency (cycles per sample))’); ylabel(‘Magnitude (Linear)’); text(-.11,40,‘b)’);
% Same thing on a dB scale spec = 20log10(magX); % Spectral magnitude in dB spec = max(spec,-60ones(1,length(spec))); % clip to -60 dB subplot(3,1,3); plot(fni,spec,’-’); grid; axis([0 1 -60 50]); % title(‘Interpolated Spectral Magnitude (dB)’); xlabel(‘Normalized Frequency (cycles per sample))’); ylabel(‘Magnitude (dB)’); text(-.11,50,‘c)’); print -deps eps/example3.eps; if dopause, disp ‘pausing for RETURN (check the plot). . .’; pause; endWith the zero padding, we see there’s quite a bit going on. In fact, the spectrum has a regularsidelobe structure. On the dB scale in Fig. 9.4c, we now see that there are indeed negative dB values. This shows the importance of using zero padding to interpolate spectral displays so that the eye can ‘‘fill in’’ properly between the samples.
Figure 9.4:Zero-Padded Sinusoid at Frequency . a) Time waveform. b) Magnitude spectrum. c) DB magnitude spectrum.
