NOTE: THIS DOCUMENT IS OBSOLETE, PLEASE CHECK THE NEW VERSION: "Mathematics of the Discrete Fourier Transform (DFT), with Audio Applications --- Second Edition", by Julius O. Smith III, W3K Publishing, 2007, ISBN 978-0-9745607-4-8. - Copyright © 2017-09-28 by Julius O. Smith III - Center for Computer Research in Music and Acoustics (CCRMA), Stanford University
<< Previous page TOC INDEX Next page >>
Reconstruction from Samples--Pictorial Version
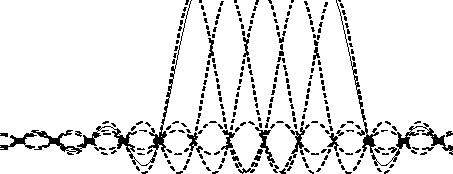
Figure A.1 shows how a sound is reconstructed from its samples. Each sample can be considered as specifying thescaling and location of a sinc function. The discrete-time signal being interpolated in the figure is
. The sinc functions are drawn with dashed lines, and they sum to produce the solid curve. Note the ''Gibb's overshoot'' near the corners of this continuous rectangular pulse due to band-limiting.
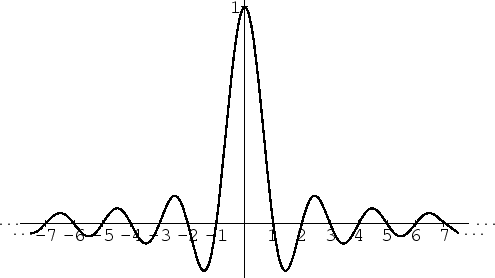
Note how each sinc function passes through zero at every sample instant but the one it is centered on, where it passes through 1. An isolated sinc function is shown in Fig. A.2.
The sinc function is the famous ''sine x over x'' curve, defined by
wheredenotes the sampling rate in samples-per-second, and
denotes time in seconds.

